Global Warming Prediction Project

Aerosol, Reflectivity and Ozone concentration prediction - Update
Jan 17, 2017
In June 2011 we published monthly ex ante decadal forecasts until October 2017 for aerosol index, reflectivity, and ozone concentration based on satellite data. Ex ante forecasts are most valuable, transparent and objective forecasts, because they cannot be fine tuned or otherwise manipulated after they have been published since everybody can evaluate the accuracy of the forecasts against the actually observed values later in time, which are usually provided independently of the forecasts by a third party. They are the only objective proof if an approach/method/model works and is useful or not. This comes at the cost that such a proof takes time, real-time.
Now, after five years have passed, it is time to make a first performance evaluation of the predictive models.
All three models are derived from satellite measurements. Satellite data cover over 98% of the earth’s surface at a high spatial resolution. A disadvantage, however, still is that the operational time especially of the early satellites is quite limited. They are replaced by new generations, which then use more sophisticated technologies and measurement instruments. The data they provide are usually not 100% compatible with their predecessor’s data. To get a consistent data set for a long period of time the data of the different satellites needs to be calibrated, which introduce some bias and uncertainty into the observation data. This has also been the case for the aerosol, reflectivity and ozone forecasts, where the satellites whose data were used for modeling and prediction are not operational anymore for several years.
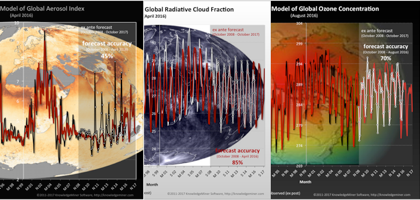
Taking this into account, here are the performance evaluations of the three decadal, monthly forecasts. The forecast accuracy range from 45% (aerosols) to 85% (reflectivity) which is useful, good and highly competitive performance.
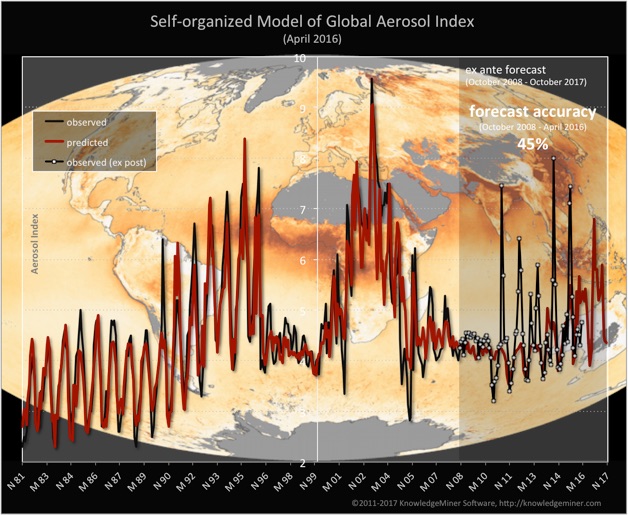
Aerosol index: The ex post forecast is from October 2008-May 2011, the ex ante forecast ranges from June 2011-October 2017. The overall forecast accuracy is 45%. For the aerosol forecast the difference in observation data provided by current [1] and previous satellite measurements has been quite large for the period 2004-2005 where both satellites operated in parallel. So the uncertainty of the calibrated ex post observation data used in this graph is supposed to be high.
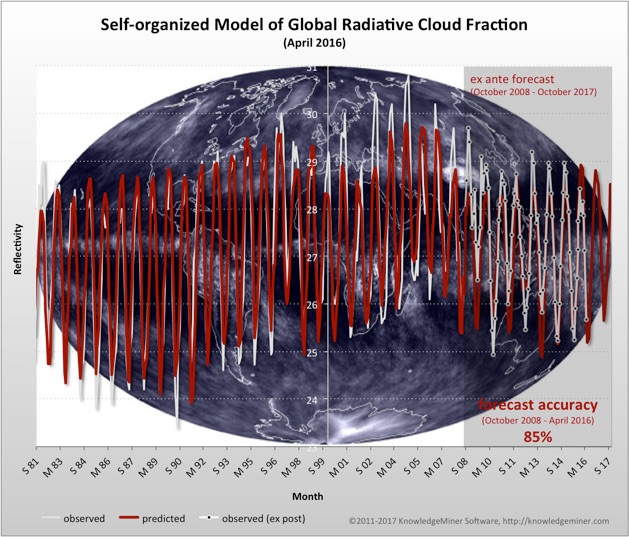
Radiative cloud fraction: The ex post forecast is from October 2008-May 2011, the ex ante forecast ranges from June 2011-October 2017. The overall forecast accuracy is 85%. The data source is [1].
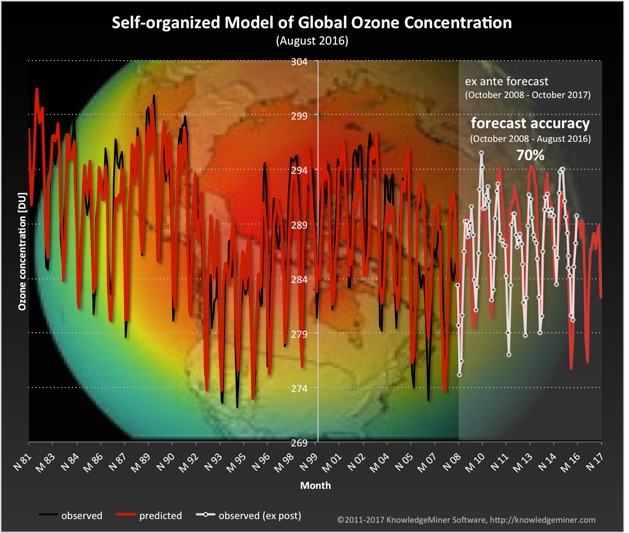
Ozone concentration The ex post forecast is from October 2008-May 2011, the ex ante forecast ranges from June 2011-October 2017. The overall forecast accuracy is 70%. The data source is [1].
The unaltered aerosol, reflectivity and ozone forecasts along with the forecast for sun activity (sunspot numbers) drive the ex ante decadal forecast of global mean temperature (also published in 2011) whose performance evaluation will be subject in a next post.
[1] Pawan K. Bhartia (Apri), OMI/Aura TOMS-Like Ozone, Aerosol Index, Cloud Radiance Fraction Daily L3 Global 1.0x1.0 deg, version 003, NASA Goddard Space Flight Center, Accessed May 14, 2016, 10.5067/Aura/OMI/DATA3001

